AWS Redshift Dashboard
What is the new Redshift Dashboard made up of?

AWS Redshift Dashboard – Redshift Dashboard View
Amazon Redshift currently provides a new console with a new Redshift Dashboard for all of its Redshift users. This new user interface and its new elements simplify administration and enhance insights into the overall performance and the health of its workloads and clusters.
The elements of this dashboard are the following:
– Create Cluster
– Purchase Reserved Nodes
– Cluster Overview
– Query Overview
-CloudWatch Alarms
– Events
– Feature Spotlight
How does the Redshift Dashboard help users?
The new monitoring dashboard in the new Redshift Console has the following characteristics:
– Less complicated for administrators to keep monitoring all of their Redshift clusters from just one page through unifying all the needed information (like events, query performance, availability status, alarms and cluster performance).
– Gives administrators the ability to see how the activity associated with their workloads operates.
– Makes it easier to manage Redshift clusters through the act of streamlining user experiences and lessening how many clicks are made during daily operations.
– Allows users to view queries along with workload management queues then get them correlated with performance of clusters.
– Lessens the time needed to see and optimize query overall performance through permitting users to search for and discover queries. Then they will be able to monitor execution analysis and query plans.
– Presents customers with the possibility of seeing the correlated execution time with cluster performance metrics and offers in-place recommendations for optimizing results.
What does the new Redshift Dashboard provide in terms of the new Query Editor?
The newly established Query Editor tends to enhance authoring of tricky queries with a SQL editor that can manipulate queries and offer visible assessment of query results. It enhances productiveness through the use of elements like keyboard shortcuts, query formatting and content assist. You are currently capable of discovering partner solutions that can get automatically integrated with Redshift without delay from the Redshift console through the utilization of the Marketplace widget.
Also, a user is capable of viewing plans of execution for queries that are carried out.
Which Regions have the AWS Redshift Dashboard on hand?

AWS Redshift Dashboard – Available Regions
Asia Pacific (Hong Kong)
Asia Pacific (Singapore)
Asia Pacific (Sydney)
Asia Pacific (Tokyo)
Asia Pacific (Mumbai)
Asia Pacific (Osaka)
Asia Pacific (Seoul)
EU (Paris), EU (Stockholm), EU (Frankfurt), EU (Ireland), EU (London)
Middle East (Bahrain)
South America (Sao Paulo)
Canada (Central)
US West (N. California) and US West (Oregon)
US East (N. Virginia), US East (Ohio)
AWS Redshift Dashboard for Monitoring
Amazon Redshift is used by a great number of users for the sake of managing their analytical workloads. This allows for some modern analytics use cases, like real-time streaming, predictive and Business Intelligence.
Most of Amazon Redshift developers or administrators or developer are eager to get their users (including BI professionals or data analysts) to reach the ideal state of workload performance. Users who tend to be anticipatory would become interested in setting up Amazon CloudWatch alarms on various Redshift metrics.
The new AWS Redshift dashboard will offer you combined visibility to all of your clusters’ performance and health.
Using the AWS Redshift Dashboard, operators and administrators are capable of keeping an eye on the following:
- Consolidated view of every single cluster event.
- The health status of clusters, their total amount, their total nodes, and their availability.
- Critical performance metrics for the first 5 clusters (# of queries, CPU utilization and database connections).
- The cluster’s CloudWatch alarms.
- Performance workloads.

AWS Redshift Dashboard – Visibility over Elements
Every widget can get its data filtered using a parameter, or you can edit the range in order to get your metric a trend analysis.
You are also capable of using the AWS Redshift Dashboard for the sake of separating cluster issues to give each problem the attention it requires.
For Instance:
In case you had a CloudWatch alarm for one of your Redshift metrics (exp: DB Connections), as it can be concluded from the following screenshot, you will be able to view the details of this alarm or details like cluster metrics and database metrics, loads and queries that are running.
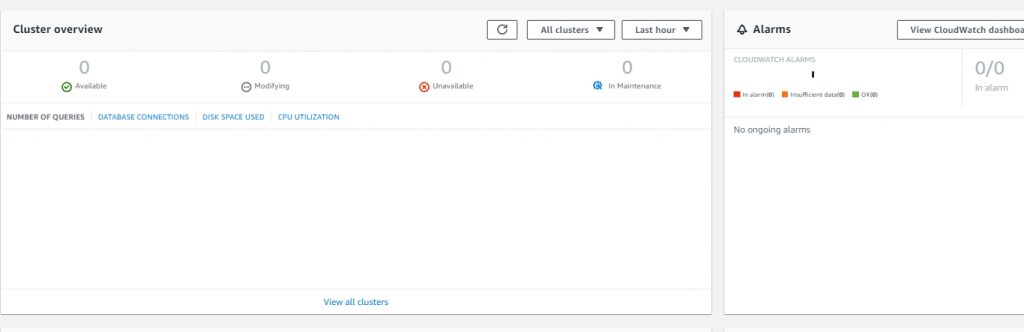
AWS Redshift Dashboard – Clusters and Alarms