Personal Health Dashboard
The Personal Health Dashboard teaches its users about health events which can effect the user’s account or services.
This data is displayed in two different ways:
– Dashboard displaying the latest and the upcoming events according to categories
– Full event log displaying every single event that happened in the last 90 days
How can the Personal Health Dashboard be viewed?
- Logging into the Management Console, then heading to the Personal Health Dashboard using the following link https://phd.aws.amazon.com/phd/home.
- Choose Dashboard for the sake of checking the latest and the upcoming events. Otherwise, click on Event log to see every single event which occurred in the last 90 days.
Personal Health Dashboard: The Dashboard
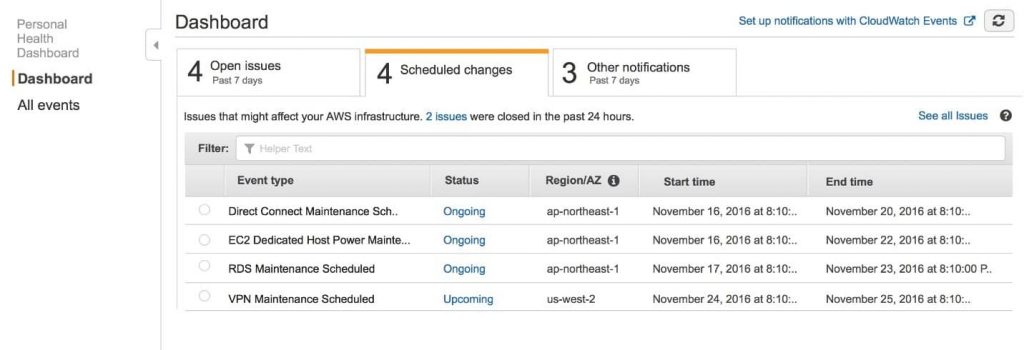
There are 3 groups of issues when using the Personal Health Dashboard:
Personal Health Dashboard – Issues Groups
- Open Issues
- Scheduled Changes
- Other Notifications
Open issues and other notifications: By default, these are restricted to issues having a start time occurring within the past 7 days.
Scheduled Changes: Includes ongoing and upcoming items.
Upon choosing a particular event from dashboard list, you will see the Event Details pane carrying info regarding this event and its affected resources.
Items can be filtered through selecting options in the filter list.
This means that you will be able to search for results by Region, AZ, service, and event end or last update time.
For the sake of viewing every single event applied to your account, and not only the most recent events, click on See all issues which is located at the top of the list for showing the Event log.
Keep in Mind
No notifications can be deleted for events displayed in the Personal Health Dashboard. Whenever a service resolves a particular event, its notification will get removed from the dashboard.
Personal Health Dashboard: Event Log
You can find every single AWS Health event applied to your account from checking the Event log page of the Personal Health Dashboard.
The layout of the column and the way it works are both the same as that of the Dashboard. However, there are extra columns and filter options in the log page for the sections, Status and Event category.
Upon picking a particular event from the Event log list, you will see the Event details pane with information about the event and its affected resources.
Items may be filtered through the selecting options.
This means that you are capable of narrowing the results according to AZ, status, category, event end time or last update time, service, and region.
Personal Health Dashboard: Event types
Health events come in 2 types:
- Public: service events not specified to a particular account.
- Account-specific: specified to either the user’s account or an organization’s account.
You can use the following options for the sake of checking whether an event is account-specific or public:
- In Personal Health Dashboard, click on the Affected resources tab from the page of Event log.
- With the Health API let the eventScopeCode parameter be returned.
Personal Health Dashboard: Event details pane
There are 2 tabs in the Event details pane.
– Details tab showing a description of the event and its related data such as: event status, name, region and AZ, category, start and end time.
– Affected resources tab showing data about whichever resources affected by this selected event:
Resource ID or an available or relevant ARN.
Items can be filtered by selecting options in filter list. Also, results may be narrowed by ARN or resource ID.
Personal Health Dashboard: Integrations
From the navigation page, you can choose the Integrations section for listing services which may get enabled with AWS Health. The below services can get integrated with AWS Health.
AWS Organizations:
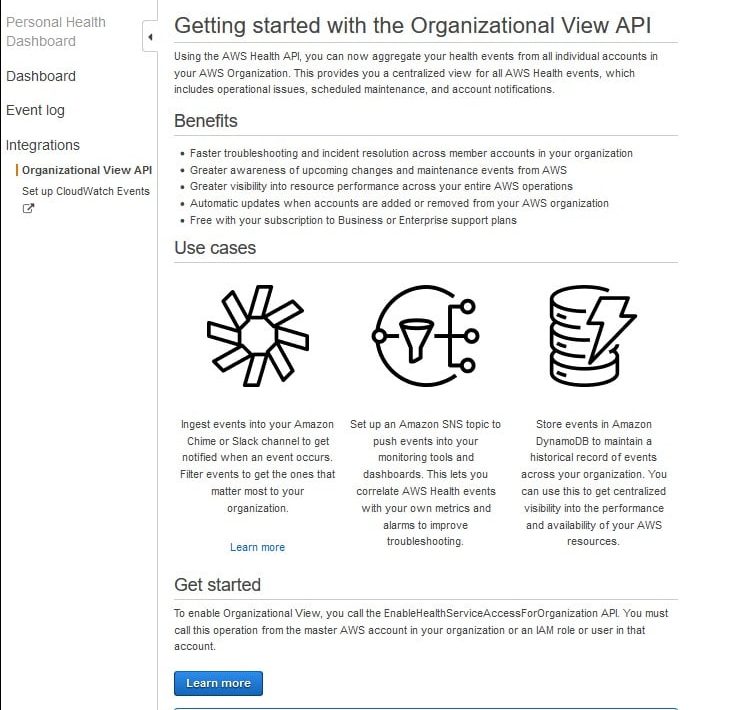
Personal Health Dashboard – Organizational View API
Health events can be checked for every single account in your organization.
Such a feature will offer you complete view for your organization’s events.
The events may be utilized for the sake of keeping track of changes in applications, services and resources.
CloudWatch Events:

Personal Health Dashboard – CloudWatch Events
CloudWatch Events may be utilized for spotting and reacting to alterations for Health events.
Certain Health events occurring in your account may be monitored. With this, you can formulate rules which will notify you or allow you to perform an action upon event changes.
It is possible to select Set up CloudWatch Events for heading to CloudWatch Events console.
To learn about CloudWatch status check alarms, check out the EC2 Instances: Status Check Alarms guide.
How do AWS Health events’ Alerts Work?
You can find a bell icon on the Personal Health Dashboard’s console navigation bar which has a menu for Alerts.

Personal Health Dashboard – Health Events Alerts
Such a feature will show you the number of latest Health events found on the dashboard in every single category.
You can locate this bell icon on multiple AWS consoles, like the IAM, RDS, Trusted Advisor and EC2.
Select the bell icon for the sake of viewing if your account got affected by some latest events.
After that, you are capable of selecting a specific event for the sake of heading to the Personal Health Dashboard to check additional information.